Get Insights From Workflow Histories Export On Temporal Cloud

Alice Yin
The Temporal Web UI provides a view of workflows and history events within a single workflow execution. Over time, each workflow history contains rich execution metadata such as Workflow Type, Start Time, Close Time, Activity, History Size, Task Queue and so on. Digging into this data can not only provide valuable feedback on operational efficiencies and bottlenecks, but also offer guidance on refining the implementation of workflows and activities.
In this post, we will guide you through how to feed workflow history into your choice of data warehouse and a few analyses you can build on top of it.
Introducing Workflow History Export
Export in Temporal Cloud allows users to export closed workflow histories to AWS S3. Once you enable Export, workflow history data lands in your S3 bucket hourly.
Next, you can start to build data pipelines to analyze closed workflow histories from the past. For more details about Export, please see our documentation.
Case study for Workflow History Analysis
Data transformation
Workflow history is exported in the Protocol Buffer (proto) format, with its schema available at temporalio/api on GitHub. Proto formats are known for their serialization efficiency and their ability to maintain compatibility across different versions. Despite these benefits, proto may not always be the ideal format for data analysis purposes.
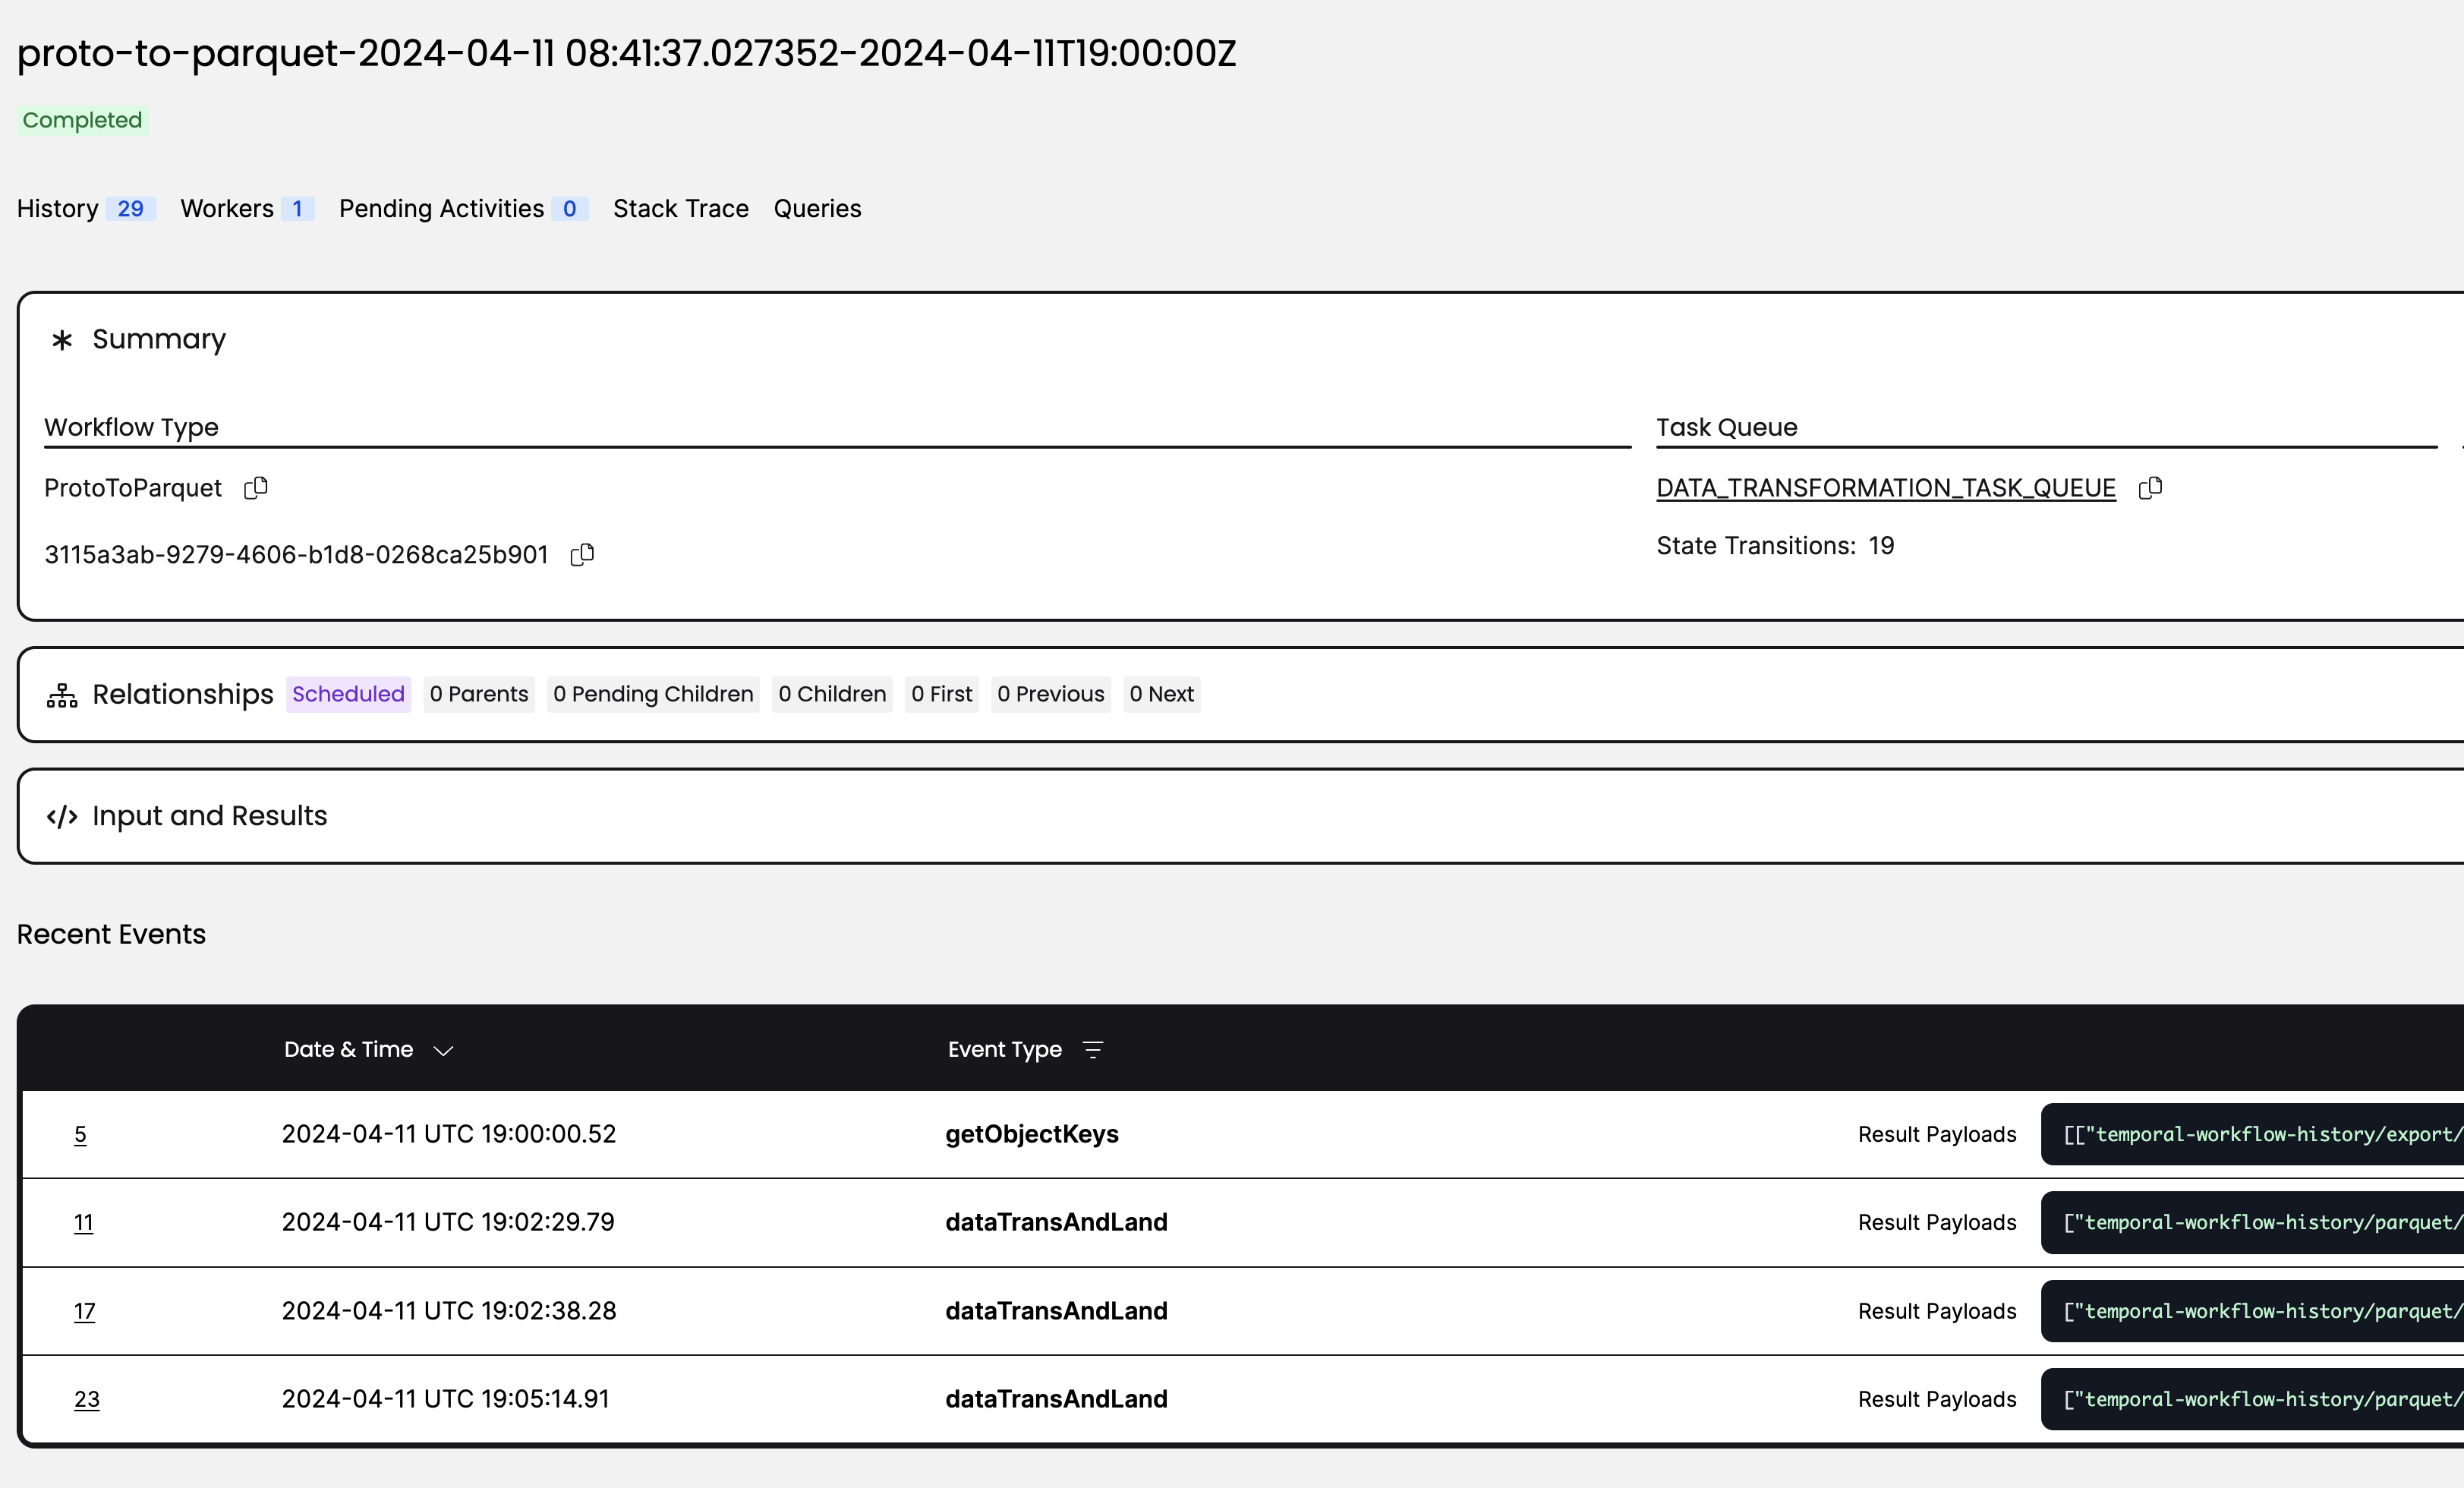
To bridge this gap, we have developed a convenient workflow that facilitates the conversion of workflow history files from proto to Parquet, making it more amenable to analysis. You can find an example of this conversion process in our cloud_export_to_parquet workflow.

When transforming data, please keep in mind the following:
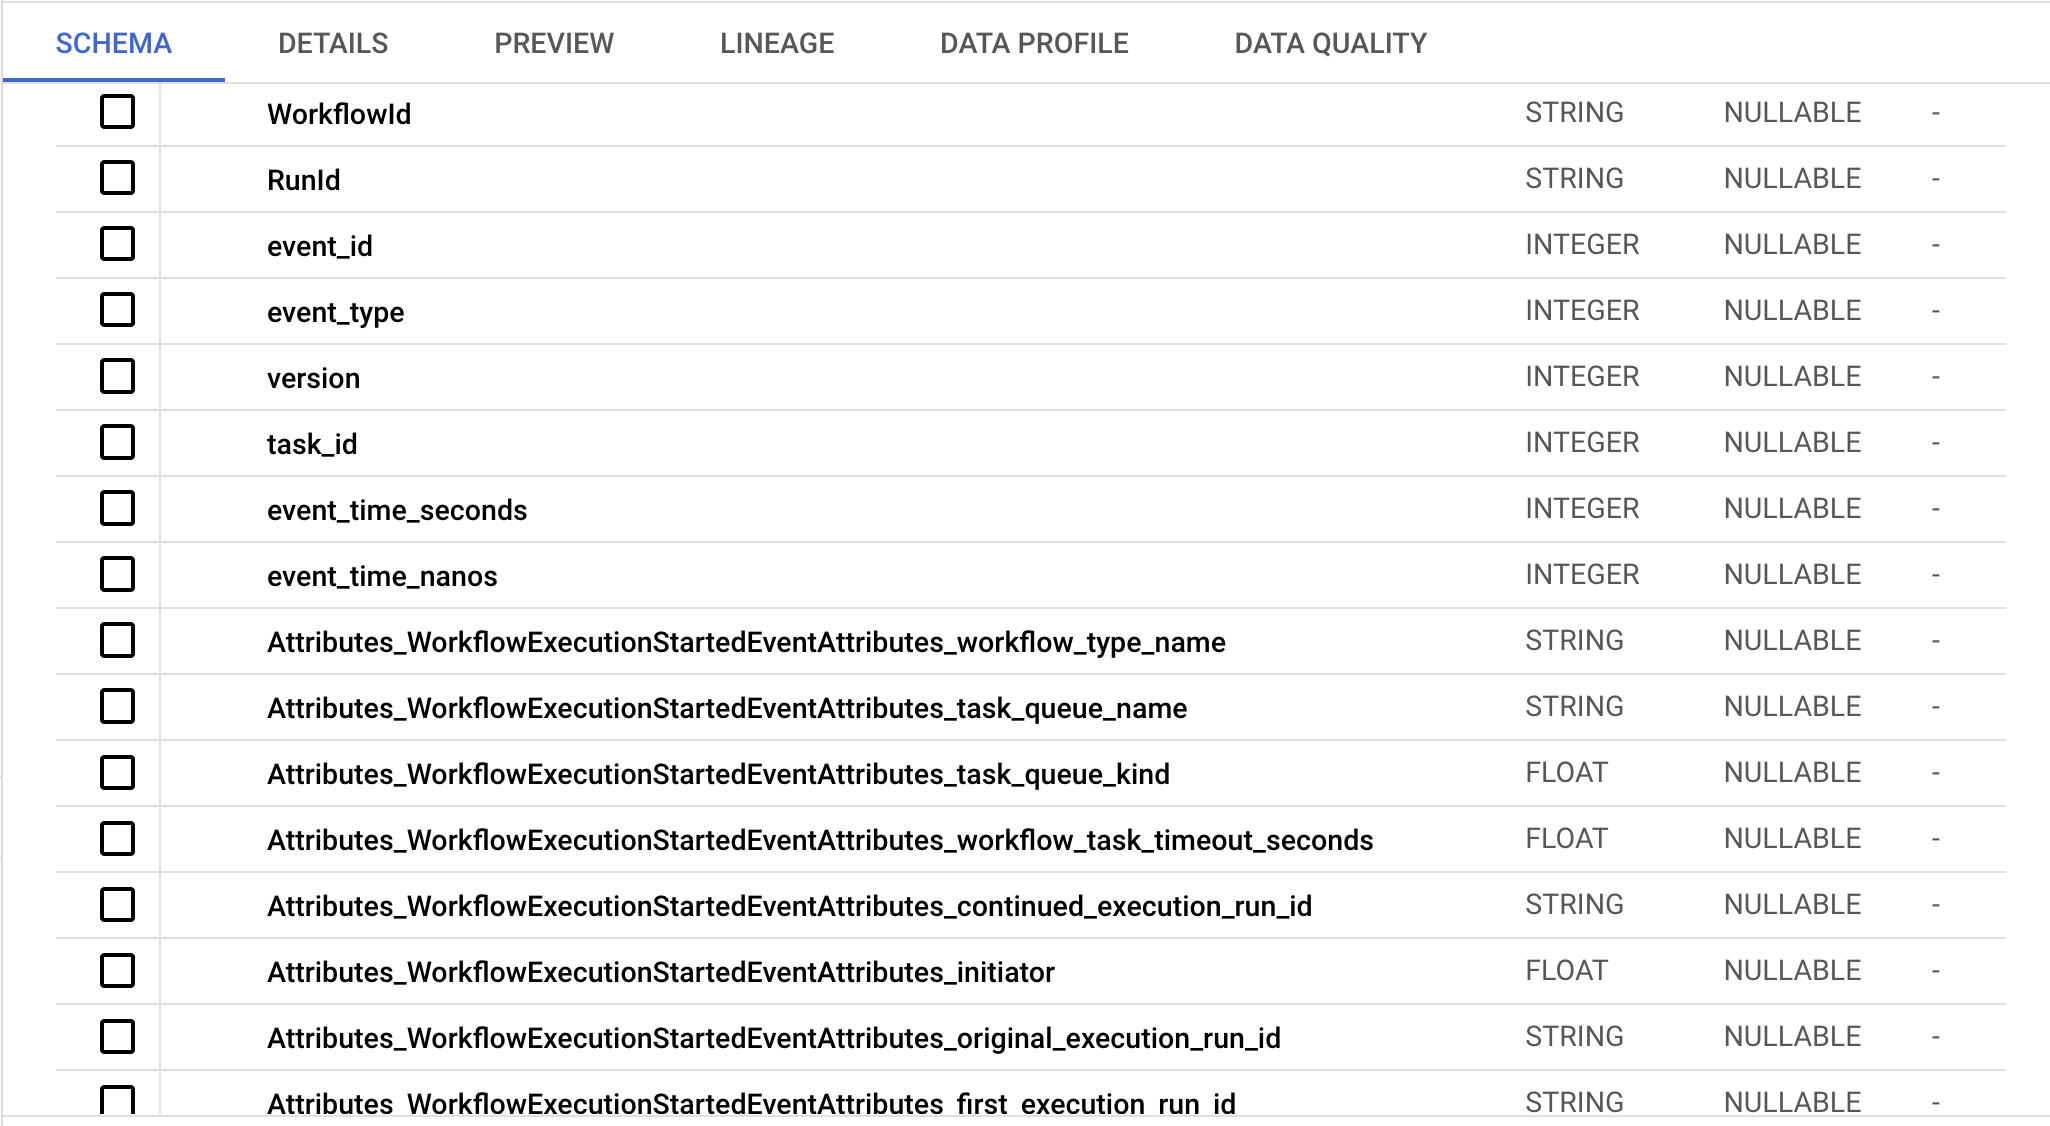
- We have transformed the nested proto structure into a flat, tabular format.
- Each row in the table represents a single history event from a workflow. To preserve their relationship post-conversion, we have included
workflowIDandrunIDin every row. - If you have enabled codec server, the payload field is encrypted. However, this field may contain characters that are not recognized when loaded into a database. As a result, we have excluded this field from the dataset.
Set up ETL pipeline and feed into datastore
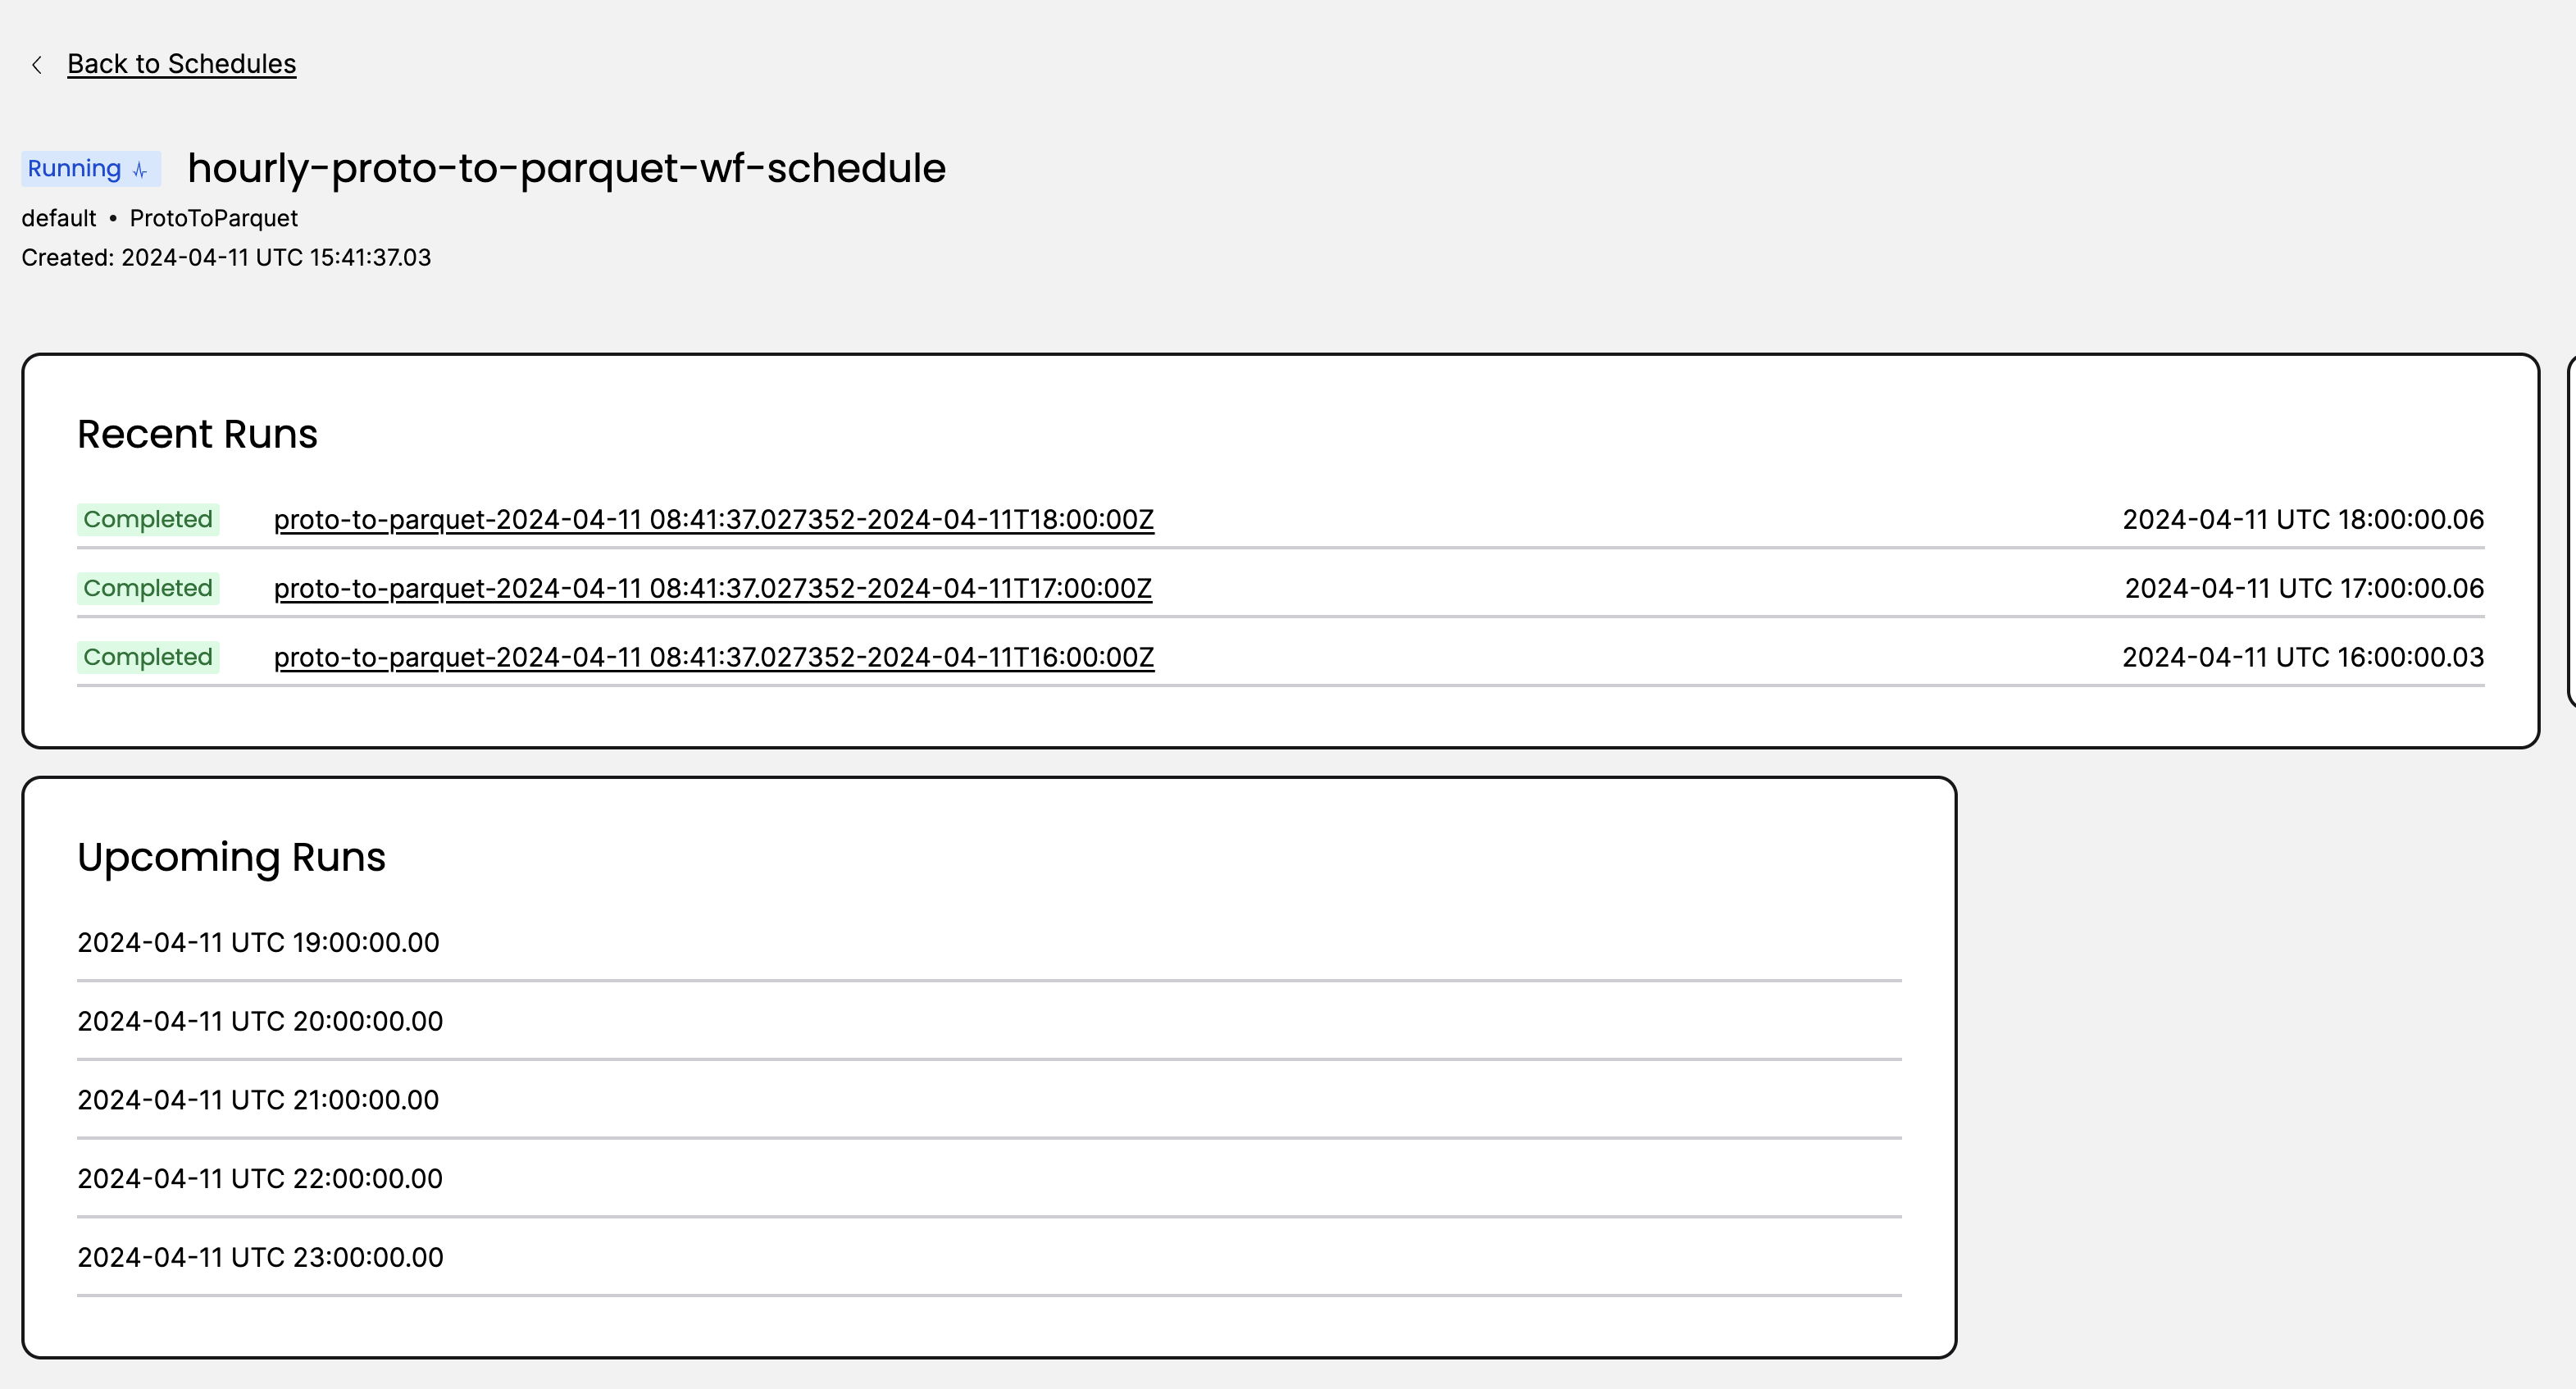
The workflow described above is actually a Temporal Schedule which can process data on an hourly basis. You could create a similar Schedule to achieve continuous transformation of exported files from proto to Parquet, which could then land in your data store or directly into Amazon S3. If you use AWS Glue, Lambda or Airflow, you could also reference the Python code in this example and build your own ETL pipeline.
After the data lands, leverage your analytical tool of choice to construct queries and derive valuable insights from workflow history data.

Conduct data analysis
After converting the nested proto file into Parquet format, upload the file into your data store of choice: AWS Athena, Redshift, Snowflake or Databricks.
This particular example uses Big Query as its data store with a dataset comprising a total of 245 columns.

Here are a few sample queries to run for useful insights.
- What type of workflow triggered most frequently on my namespace?
SELECT
    Attributes_WorkflowExecutionStartedEventAttributes_workflow_type_name as workflow_type,
    COUNT(*) as frequency
FROM
    `your table`
WHERE
  Attributes_WorkflowExecutionStartedEventAttributes_workflow_type_name is not NULL
GROUP BY
    workflow_type
ORDER BY
    frequency DESC
- What type of activities triggered most frequently on my namespace?
SELECT
    Attributes_ActivityTaskScheduledEventAttributes_activity_type_name as activity_type,
    COUNT(*) as frequency
FROM
    `your table`
WHERE
  Attributes_ActivityTaskScheduledEventAttributes_activity_type_name is not NULL
GROUP BY
    activity_type
ORDER BY
    frequency DESC
- What is the average execution time of my top 5 workflow types?
WITH RankedWorkflowTypes AS (
  SELECT
    Attributes_WorkflowExecutionStartedEventAttributes_workflow_type_name as workflow_type,
    COUNT(*) AS count
  FROM
    `your table`
  WHERE
    Attributes_WorkflowExecutionStartedEventAttributes_workflow_type_name is not NULL
  GROUP BY
    Attributes_WorkflowExecutionStartedEventAttributes_workflow_type_name
  ORDER BY
    count DESC
  LIMIT 5
),
RunIDs AS(
  SELECT
    rw.workflow_type,
    RunId
  FROM
    `your table`
  JOIN
    RankedWorkflowTypes rw ON Attributes_WorkflowExecutionStartedEventAttributes_workflow_type_name = rw.workflow_type
),
RunDurations AS (
  SELECT
    rds.workflow_type,
    r.runId,
    MAX(CASE WHEN r.event_type = 1 THEN r.event_time_seconds END) AS start_time,
    MAX(CASE WHEN r.event_type = 2 THEN r.event_time_seconds END) AS end_time,
    ABS(MAX(CASE WHEN r.event_type = 2 THEN r.event_time_seconds END) - MAX(CASE WHEN r.event_type = 1 THEN r.event_time_seconds END)) AS duration_seconds
  FROM
    `your table` r
  JOIN
    RunIDs rds ON r.RunId = rds.RunId
  GROUP BY
    r.runId, rds.workflow_type
),
AverageDurations AS (
  SELECT
    workflow_type,
    AVG(duration_seconds) AS avg_duration_seconds
  FROM
    RunDurations
  GROUP BY
    workflow_type
)
SELECT * FROM AverageDurations;
- What are my top 5 longest running activities?
 WITH ActivityEvents AS (
  SELECT
    runID,
    event_id,
    Attributes_ActivityTaskScheduledEventAttributes_activity_type_name as activity_type,
    event_time_seconds as start_time,
    LEAD(event_time_seconds) OVER(PARTITION BY runId ORDER BY event_id) AS end_time
  FROM
    `your table`
  WHERE
    event_type = 10 or event_type = 12
  ORDER BY
    runID, event_id
 ),
 ActivityDurations AS (
  SELECT
    runId,
    activity_type,
    start_time,
    end_time,
    ABS(end_time - start_time) AS duration_seconds
  FROM
    ActivityEvents
  WHERE
    ActivityEvents.activity_type is not null
),
RankedActivities AS (
  SELECT
    *,
    RANK() OVER(ORDER BY duration_seconds DESC) AS rank
  FROM
    ActivityDurations
)
SELECT
  runId,
  activity_type,
  start_time,
  end_time,
  duration_seconds
FROM
  RankedActivities
WHERE
  rank <= 5;
There is additional analysis that could be done using workflow history data
- Infer cost from workflow history
- What values are set for initialInterval and maximumAttempts most often in activity retry policy?
- What task queues are used most often?
- Which SDK and which SDK version was used in my namespace?
- When did workerVersion change in my workflow?
- What’s the last failure message on different activities?
Metrics or visibility data can help achieve some of this analysis, but if you want all the information in one place, workflow history could be your go-to choice.
Build a dashboard to visualize your results
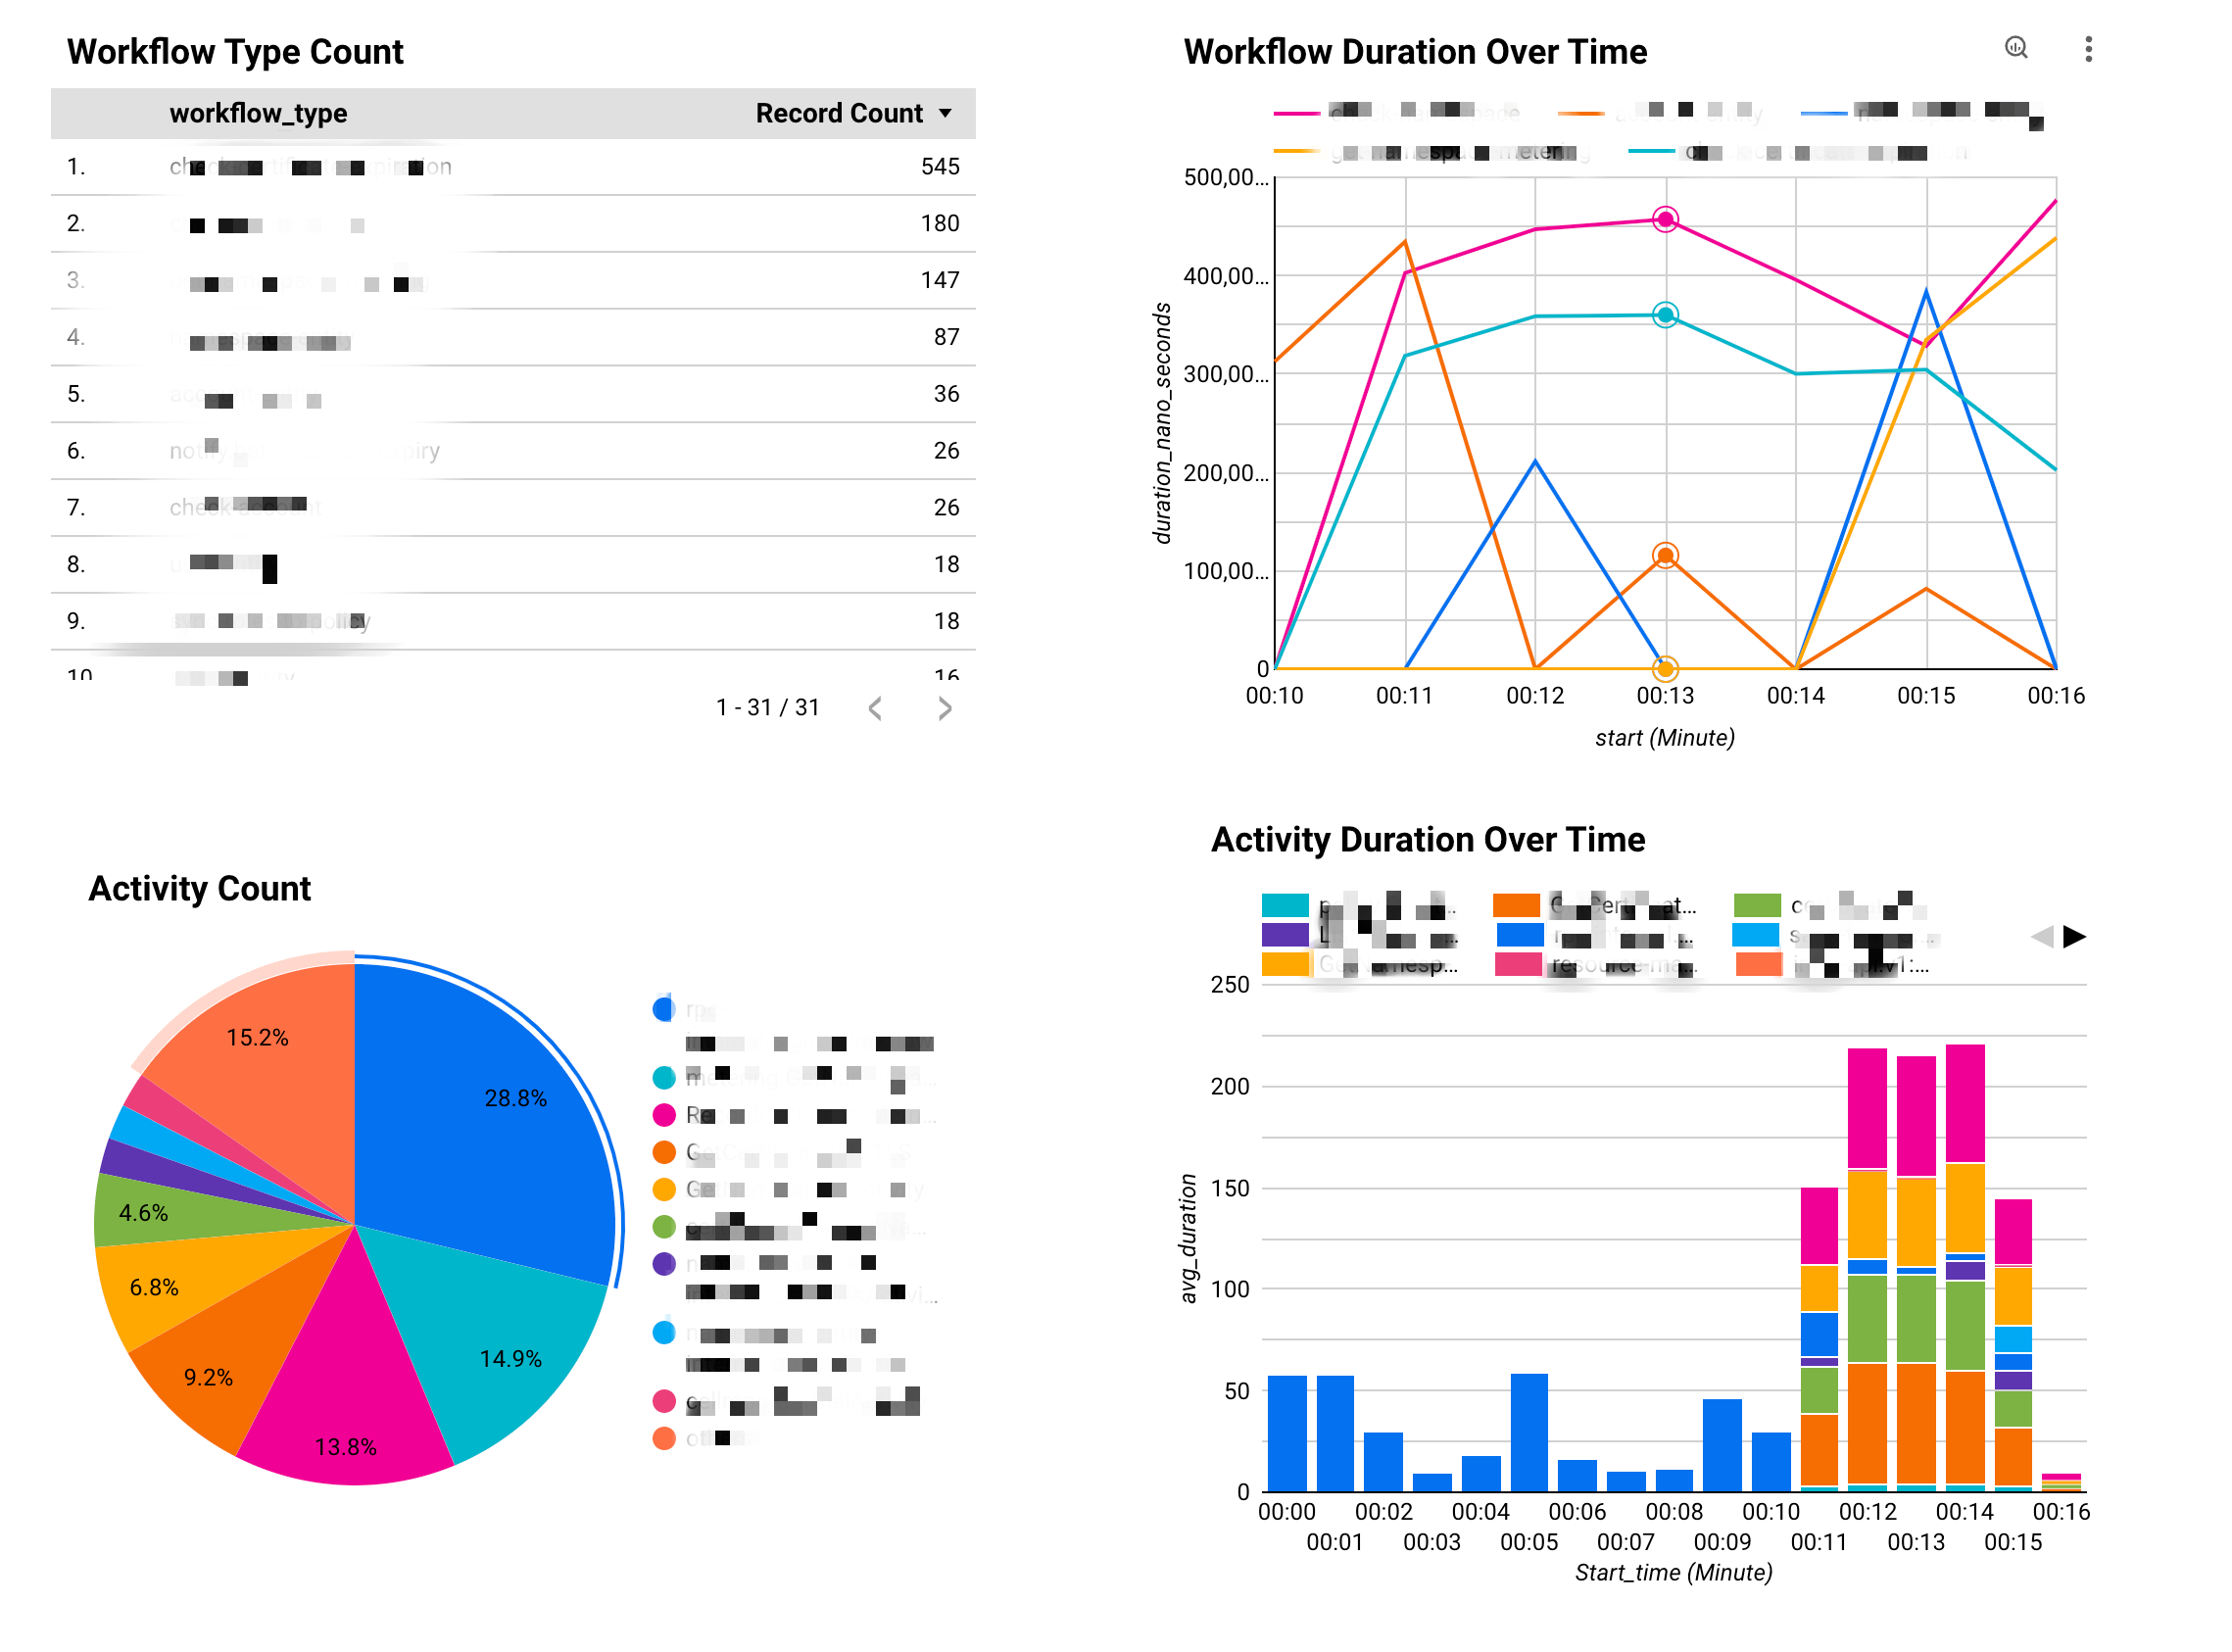
You could also build your dashboard to monitor workflow and activity execution over time. Depending on your choice of data warehouse, you could use numerous tools like Grafana, AWS QuickSight, GCP Looker etc. Here is an example powered by Looker Studio.

Current limitations
The case study presented has several identified limitations.
- Export has an “at least once” guarantee. Thus, please dedupe your data based on runID.
- The payload field was excluded from our example. Decoding this field with a codec server would enable the extraction of valuable insights from the inputs and outputs of workflows and activities.
- Given the variability in each hour's workflow history data, the schema of the Parquet files may also change. It is important to ensure that your data warehousing solutions are equipped to manage schema evolution over time.
What’s next on Temporal Cloud?
Improving the customer experience on Temporal Cloud is our foremost goal. Export is currently in public preview, and we would love to to hear your feedback at product@temporal.io. We plan to support more data types for Export to further streamline data analysis.